Deep Learning · MT2 · formulas
Mean, variance and standard deviation
The mean is a measure of location; variance and standard deviation quantify dispersion. Distinguish population and sample conventions before calculating these statistics.
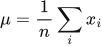 LaTeX:
\mu=\frac{1}{n}\sum_i x_i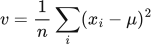 LaTeX:
v=\frac{1}{n}\sum_i(x_i-\mu)^2 LaTeX:
s=\sqrt{v}Mean, variance and standard deviation from ordinary arithmetic
Definition. The arithmetic mean measures the centre of a numerical dataset. Variance measures the average squared deviation from that mean, and standard deviation expresses dispersion in the original units.
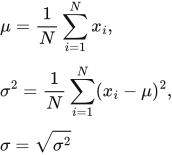 LaTeX:
\mu=\frac{1}{N}\sum_{i=1}^{N}x_i,\qquad \sigma^2=\frac{1}{N}\sum_{i=1}^{N}(x_i-\mu)^2,\qquad \sigma=\sqrt{\sigma^2}These are population formulas, or empirical moments treating the supplied dataset as the complete reference set. An unbiased sample-variance estimate instead divides the squared-deviation sum by N−1. Use the convention specified by the question; the two denominators are not interchangeable.
Question. Find the population mean, variance and standard deviation of [3, 3, 7, 7].
Given
Observations = [3,3,7,7]; N = 4.
Use population variance (divide by N).
To find
Find the population mean μ, variance σ² and standard deviation σ.
Formula — which one and why
Mean and spread. The mean is the sum divided by the number of values. Population variance averages squared distances from that mean; standard deviation is its square root.
N = number of values; xᵢ = value i; μ = mean; σ² = variance; σ = standard deviation. Σ means add the indicated terms.
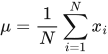 LaTeX:
\mu=\frac{1}{N}\sum_{i=1}^{N}x_i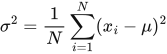 LaTeX:
\sigma^2=\frac{1}{N}\sum_{i=1}^{N}(x_i-\mu)^2 LaTeX:
\sigma=\sqrt{\sigma^2}Yaad rakhne ka cue: Mean = sabka total ÷ count; variance = squared distances ka mean.
Solution — step by step
Step 1: add all four observations.
 LaTeX:
3+3+7+7=20Step 2: divide by the count to obtain the mean.
 LaTeX:
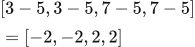
\mu=\frac{20}{4}=5Step 3: subtract the mean from each observation.
 LaTeX:
[3-5,3-5,7-5,7-5]=[-2,-2,2,2]Step 4: square each deviation.
 LaTeX:
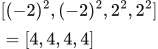
[(-2)^2,(-2)^2,2^2,2^2]=[4,4,4,4]Step 5: add the squared deviations.
 LaTeX:
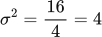
4+4+4+4=16Step 6: divide by four for population variance.
 LaTeX:
\sigma^2=\frac{16}{4}=4Step 7: take the nonnegative square root.
 LaTeX:
\sigma=\sqrt4=2Answer: mean = 5, population variance = 4 and population standard deviation = 2. Variance has squared units; standard deviation has the same units as the observations. With the sample convention, the variance would instead be 16/3.
Population mean and spread: [1, 2, 3]
Question. For the population [1, 2, 3], find mean, population variance and standard deviation.
Given
Values = [1, 2, 3]; N = 3. Use population division by N.
To find
Mean μ, variance σ² and standard deviation σ.
Formula — which one and why
The question specifies a population, so use N rather than the N−1 sample-variance divisor.
μ is the centre; σ² averages squared distances from it; σ converts spread back to the original units.
 LaTeX:
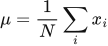
\mu=\frac1N\sum_i x_i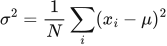 LaTeX:
\sigma^2=\frac1N\sum_i(x_i-\mu)^2LaTeX: \sigma=\sqrt{\sigma^2}Yaad rakhne ka cue: Mean, distance, square, mean again, then root.
Solution — step by step
Step 1: add all values.
 LaTeX:
1+2+3=6Step 2: divide by the number of values.
 LaTeX:
\mu=\frac{6}{3}=2Step 3: find and square deviation 1.
 LaTeX:
(1-2)=-1 LaTeX:
(-1)^2=1Step 4: find and square deviation 2.
 LaTeX:
(2-2)=0 LaTeX:
(0)^2=0Step 5: find and square deviation 3.
 LaTeX:
(3-2)=1 LaTeX:
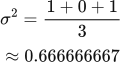
(1)^2=1Step 6: average the squared deviations.
 LaTeX:
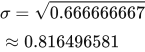
\sigma^2=\frac{1+0+1}{3}\approx0.666666667Step 7: take the nonnegative square root.
 LaTeX:
\sigma=\sqrt{0.666666667}\approx0.816496581Final answer: μ = 2; σ² ≈ 0.666666667; σ ≈ 0.816496581.
Population mean and spread: [2, 2, 2]
Question. For the population [2, 2, 2], find mean, population variance and standard deviation.
Given
Values = [2, 2, 2]; N = 3. Use population division by N.
To find
Mean μ, variance σ² and standard deviation σ.
Formula — which one and why
The question specifies a population, so use N rather than the N−1 sample-variance divisor.
μ is the centre; σ² averages squared distances from it; σ converts spread back to the original units.
LaTeX: \mu=\frac1N\sum_i x_iLaTeX: \sigma^2=\frac1N\sum_i(x_i-\mu)^2LaTeX: \sigma=\sqrt{\sigma^2}Yaad rakhne ka cue: Mean, distance, square, mean again, then root.
Solution — step by step
Step 1: add all values.
 LaTeX:
2+2+2=6Step 2: divide by the number of values.
LaTeX: \mu=\frac{6}{3}=2Step 3: find and square deviation 1.
LaTeX: (2-2)=0LaTeX: (0)^2=0Step 4: find and square deviation 2.
LaTeX: (2-2)=0LaTeX: (0)^2=0Step 5: find and square deviation 3.
LaTeX: (2-2)=0LaTeX: (0)^2=0Step 6: average the squared deviations.
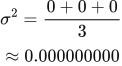 LaTeX:
\sigma^2=\frac{0+0+0}{3}\approx0.000000000Step 7: take the nonnegative square root.
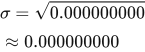 LaTeX:
\sigma=\sqrt{0.000000000}\approx0.000000000Final answer: μ = 2; σ² ≈ 0.000000000; σ ≈ 0.000000000. Standardization is undefined with this zero standard deviation.