Disaster Management · TEE · mocks
TEE mock B
TEE practice
New 100-mark practice papers using the observed recent choice pattern
100 marks · 3 hours. Q1(a–d) compulsory; attempt any four complete questions from Q2–Q7. These are authored practice questions using the observed choice structure. Practice marks are writing targets, not an official marking scheme or a forecast.
Q1(a). Distinguish earthquake magnitude from intensity. [5 practice marks]
Answer
Definition. Magnitude describes earthquake size using instrument-based scales. Intensity describes the shaking and effects at a particular location.
| Basis | Magnitude | Intensity |
|---|---|---|
| Refers to | Size of the source event. | Effects at a site. |
| Values | An event has an estimated magnitude for a specified scale; estimates can be revised. | One event has many site intensities. |
| Scale example | Local magnitude Mₗ / moment magnitude M𝑤. | Modified Mercalli intensity I–XII. |
| Evidence | Seismic recordings or seismic moment. | Felt reports, movement and damage observations. |
| Depends on site? | Not a separate magnitude for each town. | Changes with distance, local soil and built environment. |
Example: a magnitude 6 earthquake may be strongly felt near the source and weakly felt far away. The magnitude has not “become 3” in the distant town; local shaking intensity is lower. Magnitude does not directly tell you a death toll.
Reading the Modified Mercalli scale
I means not felt except under special circumstances; II–III are weakly felt; IV–V become widely noticeable; VI–VII can involve damage, especially to vulnerable construction; VIII–IX indicate severe damage; X–XII represent very severe to extreme effects. These are descriptive intensity levels, not energy multiplication factors.
Q1(b). Explain disaster classification using the Indian Ocean tsunami. [5 practice marks]
Answer
Chain: natural geophysical trigger (undersea earthquake) → physical ocean-wave/inundation hazard → water, land, settlements and livelihoods affected → international/transboundary disaster for the Indian Ocean event of 26 December 2004.
Definition. Classification groups disasters by a stated property. The same event can have different labels under different bases; those labels are not competing answers.
| Basis used in the lecture | Categories | Example: Bhopal gas tragedy |
|---|---|---|
| Origin / occurrence | Natural; human-induced; biological events considered separately where appropriate | Human-induced industrial event |
| Hazardous characteristic | Chemical, biological, radiological or physical | Chemical: toxic methyl isocyanate release |
| Affected environmental / social component | Air, water, soil and society; more than one may be affected | Primarily toxic air exposure with serious social and health consequences |
| Geographic / administrative reach | Local, state/regional (“domicile” in the lecture), national, international/global | The release was local to Bhopal; response and consequences involved wider levels. |
Legal / administrative boundaries: each course category with an example
| Category in the lecture | Meaning | Example and why it fits |
|---|---|---|
| Local | The affected area is within a locality or community. | Illustrative example: a serious factory fire disrupts one industrial neighbourhood. Its immediate geographic impact is local, even if outside firefighters assist. |
| Domicile / regional | The affected area extends across a region or state. | The 2018 Kerala floods illustrate a disaster affecting many districts within a state. National assistance does not change the location of the main affected area. |
| National | Effects and coordinated action extend across a country. | COVID-19 can be studied at the national scale through its effects across India and the countrywide response. |
| Global / international | Effects extend across national borders. | The COVID-19 pandemic affected countries worldwide, so it also illustrates the global scale. The same event can be discussed at more than one geographic scale. |
These labels describe the geographic reach used in the faculty classification. They do not establish that a government formally declared an event a “national disaster”. State the affected area and explain the chosen label; keep the level of assistance separate.
Five hazard groups
| Hazard group | Example | Possible disaster |
|---|---|---|
| Geological / geophysical | Fault rupture | Damaging earthquake |
| Hydrometeorological | Extreme rainfall / cyclone | Flood or coastal storm disaster |
| Biological | Pathogen transmission | Epidemic or pandemic |
| Technological | Hazardous industrial release | Chemical gas disaster |
| Environmental | Degraded ecosystems or severe pollution | Loss of ecosystem services and increased disaster vulnerability |
A natural trigger does not mean all losses are unavoidable. Poor siting or construction can intensify losses. Forest fires may start from lightning or from human actions, so classify their origin according to the known ignition cause. “Domicile” here is course terminology for a regional/state reach, not a standard scientific measure of severity.
Q1(c). Explain the role of NGOs with four examples. [5 practice marks]
Answer
NGOs can complement public authorities through local knowledge, relief, inclusion, training and recovery. They should coordinate needs assessment, avoid duplication and remain accountable to affected people.
- SEEDS. Works on disaster response, resilience, community skills and safer built environments.
- Goonj. Connects material relief and community-led work with dignity and recovery needs.
- ActionAid Association. Supports inclusive emergency preparedness, response and recovery, with attention to marginalised communities.
- CARE. Provides humanitarian support across emergencies, including essential needs and recovery activities through its programmes and partners.
An NGO is not the incident-command authority merely because it provides relief. Clear roles and coordination with designated authorities are necessary.
Q1(d). Explain the need for awareness generation. [5 practice marks]
Answer
Awareness generation helps people recognise their local hazards, understand warnings and know how to obtain assistance. It is needed because unfamiliar terms, rumours and inaccessible messages can prevent action even when a technically accurate forecast exists.
- Explain local risk. Use familiar places and examples so residents understand who may be affected and why.
- Teach protective action. Show the warning signal, safe route, assembly point and essential preparations rather than giving only slogans.
- Include different audiences. Use local languages, accessible formats and suitable times for children, workers, older people and visitors.
- Build trust and coordination. Identify official information sources and encourage community participation, reporting and mutual support.
- Link awareness to practice. Follow explanation with training and drills, collect feedback and correct gaps. Knowing a message is different from being able to act on it.
Q2(a). Explain disaster scale with a cyclone example and sketch. [10 practice marks]
Answer
Definition. A response level indicates the capacity needed to manage an event. It is different from a physical magnitude or intensity scale.
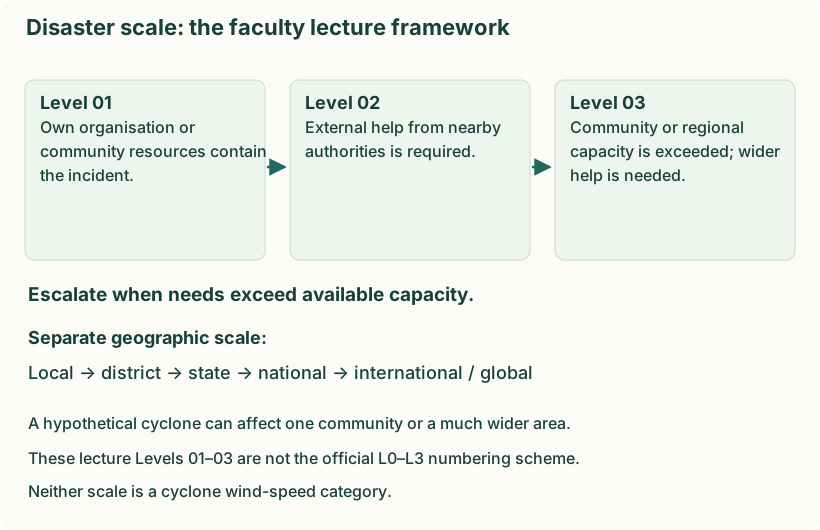
1. Three levels used in the faculty lecture
| Lecture level | Meaning | Cyclone illustration — a hypothetical escalation |
|---|---|---|
| Level 01 | An organisation, institution or community contains the incident using its own resources. | A community shelter deals with limited roof damage and assists its occupants using its trained team and stored supplies. |
| Level 02 | The affected organisation or community needs external help from nearby authorities. | Damage exceeds that team’s resources, so nearby fire, medical and local-authority services provide additional help. |
| Level 03 | The event exceeds the community or regional capacity and requires district / provincial or wider assistance. | Several affected communities need coordinated district/state evacuation, shelter, transport and specialist support. |
2. Geographic / administrative scale
Local → district → state → national → international / global. These describe how widely an event affects people and which territorial levels become involved. For a cyclone, one settlement may be affected locally, several settlements across a district may require district coordination, and several districts or states may require wider support. International assistance is an additional possibility when requested and needed, not an automatic final stage of every disaster.
3. Why numbering conventions must not be mixed
Indian disaster plans also use an L0–L3 planning convention: L0 is normal preparedness; L1 can be handled at district level; L2 requires state assistance; L3 requires national assistance when state and district capacity is exceeded. This is a different definition of the numbers from the lecture’s organisation/community-based Levels 01–03 above. For this course’s “disaster scale” answer, explain the lecture framework first. If a question explicitly gives the official planning convention, use that convention throughout.
4. Significance of the scale
- Recognise unmet needs: compare actual damage and urgent requirements with available people, equipment and supplies.
- Escalate early: request outside help before local services are overwhelmed.
- Assign coordination: identify which agencies must cooperate and who will communicate decisions.
- Allocate resources: send rescue teams, transport, shelters and medical support where the gap is greatest.
- Review as conditions change: a cyclone’s scale can grow or reduce as impacts and capacity change. Wind speed alone does not determine the response level.
Q2(b). Explain GIS-based drought mapping. [10 practice marks]
Answer
GIS links information to location, allowing drought indicators and affected people to be analysed together. Remote sensing supplies repeated observations; field verification is still needed.
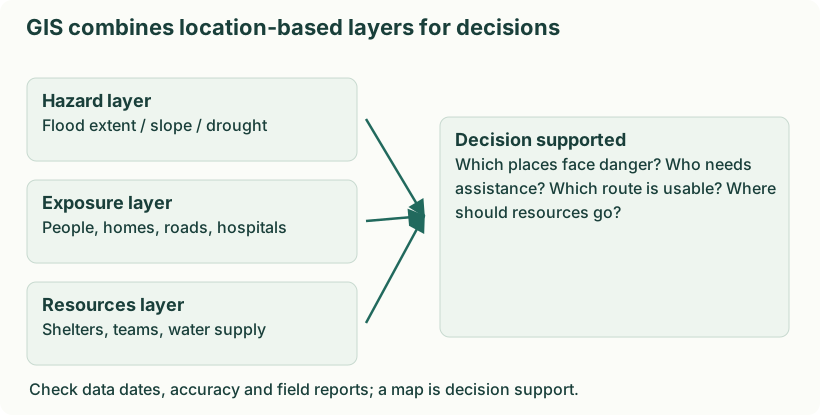
- Map rainfall deficits. Compare rainfall with the local long-term pattern and map persistent deficits. For example, identify districts with deficient seasonal rainfall rather than applying one national rainfall threshold.
- Observe soil and vegetation. Use soil-moisture information and vegetation indicators to locate crop stress. Ground observations help separate drought stress from disease, land-use change or poor data.
- Map available water. Locate reservoirs, wells, streams and supply systems and track their condition. Overlay settlements to identify people far from reliable drinking-water sources.
- Assess vulnerability. Combine rain-fed cultivation, livestock, poverty and access data with hazard indicators. Two equally dry areas can need different support because livelihood and service conditions differ.
- Prioritise and monitor action. Select recharge, supply and livelihood interventions and map their progress. For example, direct emergency water to poorly served settlements while planning long-term watershed work.
- Communicate limitations. Show data dates, uncertainty and update schedules. A map supports judgement; it does not automatically prove a village has water or that an individual household received relief.
Q3(a). Explain the hierarchy of disaster management in India. [10 practice marks]
Answer
Definition. India’s disaster management framework distributes policy, planning and response responsibilities across national, state, district and local levels.
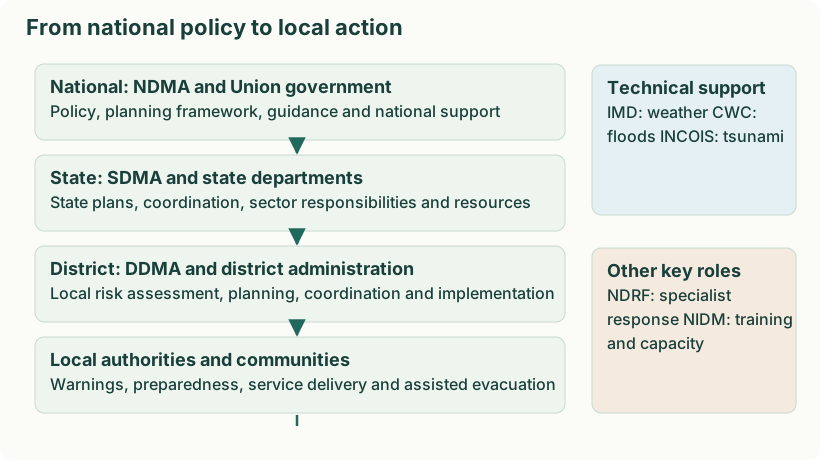
| Body | Full name / leadership | Main role |
|---|---|---|
| NDMA | National Disaster Management Authority; chaired by the Prime Minister | National policy, plans, guidelines and coordination for risk reduction and effective response. |
| SDMA | State Disaster Management Authority; chaired by the Chief Minister | State policy, plans and coordination adapted to the state’s risks. |
| DDMA | District Disaster Management Authority; headed by the District Magistrate / Collector / Deputy Commissioner | District planning, coordination, preparedness and local implementation; elected local representative has a co-chairing role under the Act. |
| NDRF | National Disaster Response Force | Specialist response including search, rescue and disaster operations. |
| NIDM | National Institute of Disaster Management | Training, capacity building, research and documentation. |
| Local authorities | Municipalities, panchayats and local services | Maintain local services, implement safety measures and assist warnings, evacuation and relief. |
An authority frames policy and coordinates. A force provides operational response. An institute develops skills and knowledge. They are not interchangeable. State and local services also respond; it is incorrect to suggest that only NDRF does rescue.
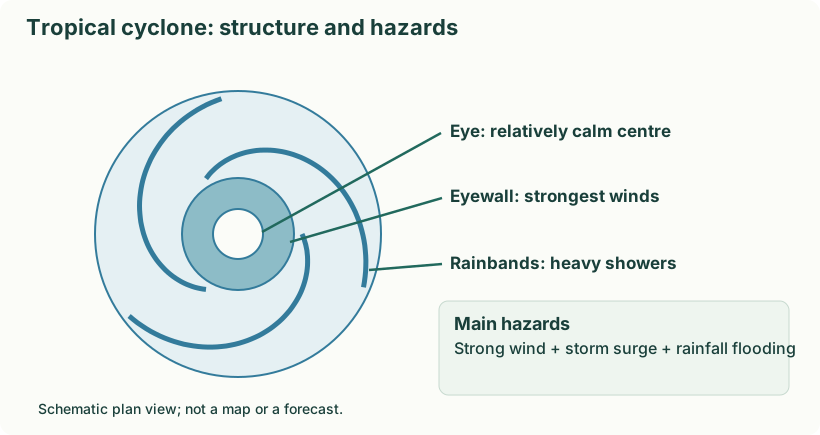
Q3(b). Explain cyclone formation, structure and hazards with a sketch. [10 practice marks]
Answer
Definition. A cyclone is an atmospheric circulation around a low-pressure centre. A tropical cyclone is an organised rotating storm over warm tropical or subtropical waters, with strong winds, rain and potentially storm surge.
- Warm ocean water supplies moisture and energy by evaporation. Typical favourable sea-surface temperatures are around 26–27°C or higher over adequate depth.
- Warm moist air rises; condensation releases latent heat, supporting further rising motion.
- Air flows towards the low-pressure centre. Earth’s rotation helps organise the circulation; systems do not usually form right at the equator.
- With favourable conditions such as sufficient moisture and limited disruptive vertical wind shear, the system organises and intensifies.
- A mature system may develop an eye surrounded by an eyewall. It weakens when it loses favourable ocean energy or encounters hostile atmospheric conditions.
| Part | Meaning |
|---|---|
| Eye | Relatively calm central region with descending air in a well-developed cyclone. |
| Eyewall | Ring of intense convection; strongest winds and heavy rainfall are commonly found here. |
| Rainbands | Spiral bands of clouds and rain around the centre. |
| Track | The path followed by the storm; forecasts have uncertainty. |
Definition. The principal tropical-cyclone hazards are strong winds, heavy rainfall and storm surge. Their combined effects can create cascading damage.
| Hazard | Mechanism | Damage |
|---|---|---|
| Wind | Strong pressure gradients drive fast winds. | Roof damage, flying debris, fallen trees and power lines. |
| Rain | Intense rainfall produces runoff. | River/urban flooding and landslides. |
| Storm surge | Wind pushes sea water towards shore; low pressure adds a smaller contribution. | Coastal inundation, saltwater intrusion and erosion. |
Storm tide combines astronomical tide and storm surge; waves and river flooding can compound impacts further. A tsunami is a different process, usually generated by sudden displacement of the water column.
Names and classifications without mixing systems
Hurricane is the regional name used in the Atlantic and northeast Pacific; typhoon in the northwest Pacific; tropical cyclone or cyclonic storm is used in the Indian Ocean context. A tornado is a small-scale rotating column connected to a thunderstorm and is not a South American synonym for tropical cyclone. A mesocyclone is a rotating thunderstorm updraft. Polar and extratropical cyclones occur in different environments and should not be described as identical warm-ocean systems.
In the Northern Hemisphere, cyclonic circulation is anticlockwise; in the Southern Hemisphere, clockwise. India’s Bay of Bengal and Arabian Sea coasts both face serious cyclone risk. Not every Indian cyclone is moderate.
Wind categories need their own units and definitions
The PPT shows both a Saffir–Simpson hurricane image and a gust-based five-category table. They are not interchangeable with IMD’s North Indian Ocean classification. Use the named system supplied in a question; do not mix gust speed with sustained wind speed. The key M2 concepts are formation, hazards, warnings and mitigation.
Q4(a). Explain causes, impacts and mitigation of drought. [10 practice marks]
Answer
Definition. Drought is an abnormal period of water deficiency relative to a region’s needs and usual conditions. It develops through rainfall, soil moisture, water storage and demand—not simply one hot day.
| Type | Meaning | Example |
|---|---|---|
| Meteorological | Precipitation is substantially below the normal pattern over a relevant period. | A poor monsoon. |
| Agricultural | Soil moisture is insufficient for crop requirements at a growth stage. | A long dry spell during crop flowering. |
| Hydrological | Reduced streamflow, reservoir storage or groundwater. | Low reservoir levels after successive deficient seasons. |
| Socio-economic | Water shortage disrupts supply of goods or services relative to demand. | Insufficient water for drinking, irrigation and industry. |
Why impacts vary
Rainfall deficit is a trigger; high evaporation, water-intensive demand, depleted aquifers and poor storage can intensify shortages. Rain-fed farmers, livestock-dependent households and people with limited savings may be especially vulnerable. Agricultural drought can develop before large reservoirs become depleted; hydrological impacts can persist after rainfall improves.
- Conserve rainfall and restore watersheds. Use suitable rainwater harvesting, contour measures and recharge work. Site-specific geology and maintenance determine whether water can be stored or recharge groundwater effectively.
- Use water efficiently. Repair leaks, use appropriate irrigation scheduling and adopt efficient systems where suitable. Saving water at one point should be reflected in an overall water budget rather than expansion that cancels the saving.
- Plan crops and livelihoods. Choose crops and sowing decisions suited to local water availability; diversify income where feasible. This reduces dependence on a single water-intensive crop or season.
- Monitor shortages and manage demand. Track rainfall deficits, soil moisture, reservoir levels and groundwater. Prioritise drinking water, protect essential services and agree fair allocation before supplies become critical.
- Prepare community support. Communicate advisories, arrange safe emergency drinking-water supply and fodder, and support vulnerable livelihoods. Emergency relief addresses immediate suffering while long-term measures reduce the next drought’s impacts.
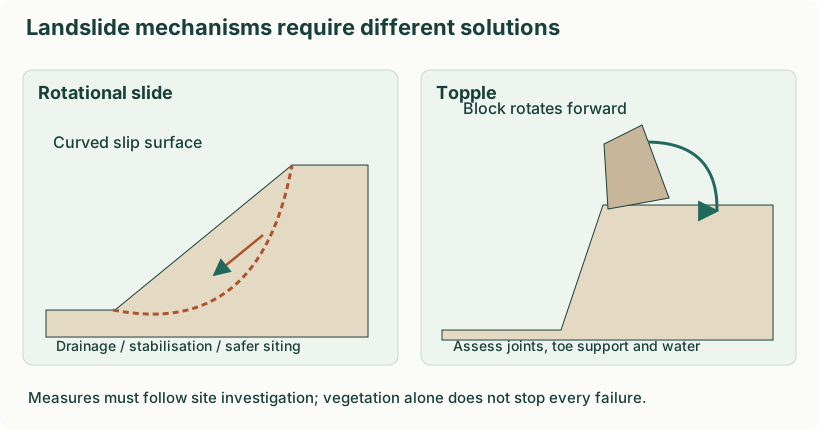
Q4(b). Explain two landslide types with sketches and suitable measures. [10 practice marks]
Answer
Definition. A landslide is downward movement of rock, debris or earth under gravity. Its movement may be falling, toppling, sliding, spreading or flowing.
| Type | Movement | Illustration |
|---|---|---|
| Fall | Material detaches and falls through air. | Rockfall from a steep cliff. |
| Topple | A block rotates forward around a pivot or base. | Jointed rock columns lean and overturn. |
| Slide | Material moves along a recognisable slip surface. | Rotational slide on a curved surface or translational slide on a plane. |
| Flow | Material deforms and moves like a flowing mass. | Water-saturated debris flow. |
| Spread | Extension and lateral movement, sometimes over a weak layer. | Ground spreading associated with liquefaction. |
Why a slope becomes unstable
- Rain infiltration raises pore-water pressure and can reduce effective resistance.
- River erosion or road cutting removes support at the slope toe.
- Earthquake shaking adds destabilising forces.
- Weak or weathered rock and unfavourably oriented joints create possible failure surfaces.
- Deforestation, added loads, excavation and poor drainage can increase susceptibility.
Cracks, tilting trees or poles, new seepage and small falls can indicate instability, but no single sign reliably predicts every landslide. Report suspected movement and follow local evacuation advice; do not enter an active slide to investigate.
Mitigation matched to mechanism
Rotational slide: investigate the curved slip surface, reduce infiltration, manage loading and toe support and restrict unsafe development. Topple: investigate fractured blocks, control water and use suitable specialist anchoring/support or exclusion and catch measures. The same retaining wall is not a universal solution for both.
Q5(a). Explain four modes of media used in disaster management with examples and justification. [10 practice marks]
Answer
For disaster information across preparedness, response and recovery, communication must connect the warning to a protective action. Use several channels, accessible languages and backup power, and assign responsibility for updates.
- Official mobile alerts. Send location-specific SMS/cell-broadcast or official app alerts with the hazard, time, expected impact and action. They are fast and can be updated, but cannot be the only method because phones, power or networks can fail.
- Broadcast media. Use radio and television to explain the warning in local languages, repeat protective instructions and correct rumours. Battery radio provides a backup when electricity or mobile data is unavailable.
- Local public-address and community networks. Use sirens with a taught meaning, announcements, police, local volunteers and door-to-door assistance where safe. These methods reach people who cannot read a text alert or need physical evacuation support.
- Operational radio and verified digital updates. Use two-way radio for field teams and control rooms, with official web/social updates for public information. Team reports help correct road closures and resource needs; verify updates before forwarding them.
Message structure: authority and issue time → affected place → hazard and expected impact → protective action and safe destination → next update/contact. Confirm that high-risk groups received and understood the message; broadcasting alone does not prove successful evacuation.
Q5(b). Explain how risk mapping identifies flood-prone areas and describe its four steps. [10 practice marks]
Answer
Definition. Risk assessment identifies hazards and evaluates exposure, vulnerability and capacity to understand possible losses and priorities. Risk mapping represents that information geographically.
- Identify risk: determine what can happen, where and to whom. For a flood, gather past inundation, low ground, river and settlement data.
- Assess risk: examine likelihood, depth/velocity, people and assets, construction and coping capacity. Rank areas by potential harm.
- Communicate risk: provide understandable maps, warnings and explanations to planners, responders and residents. Include uncertainty and local accessibility needs.
- Mitigate risk: apply zoning, drainage improvements, shelters, evacuation and training; update the assessment after changes.
Analysis and assessment
| Disaster analysis | Damage / needs assessment |
|---|---|
| Explains why and how an event produced losses. | Estimates what has been damaged and what assistance is needed. |
| Investigates mechanisms, vulnerabilities and failures. | Measures affected people, services, losses and recovery requirements. |
| Uses event data, models and causal investigation. | Uses surveys, inspections, inventories and field reports. |
| Supports long-term prevention and improved planning. | Supports relief allocation and recovery priorities. |
This comparison concerns post-disaster damage/needs assessment. Assessment is not restricted to after a disaster: pre-event risk assessments are essential too. Neither word guarantees greater accuracy by itself.
Q6(a). Explain GIS applications in recovery. [10 practice marks]
Answer
- Assess spatial damage. Compare pre-event records with imagery and field surveys to map damaged buildings, roads, crops and utilities.
- Prioritise restoration. Locate hospitals, drinking-water systems and isolated settlements so critical services and access are restored in a reasoned sequence.
- Match needs and resources. Map shelter, livelihoods and assistance coverage to reveal underserved areas; verify needs with affected communities.
- Plan safer reconstruction. Overlay hazard and land-use constraints to avoid rebuilding critical assets in the same high-risk locations.
- Monitor progress. Update repair status, housing completion and access to services. A shared map reduces duplication and supports transparent review.
- Review and protect data. Document uncertainty and survey dates, correct discrepancies and limit access to sensitive personal information.
Q6(b). Explain disaster roles of four engineering specialisations. [10 practice marks]
Answer
Engineers reduce risk through safe design, reliable infrastructure, technical assessment and coordinated restoration. They work within their competence and alongside emergency authorities.
| Specialisation | Before | Response and recovery example |
|---|---|---|
| Civil/structural | Assess sites, use seismic/flood-resistant design and inspect structures. | Assess damaged bridges/buildings and guide safe repair or reconstruction. |
| Mechanical | Maintain pumps, machinery, pressure systems and safety interlocks. | Restore pumping and essential plant safely; investigate failures. |
| Electrical | Protect supply systems and provide appropriate redundancy and backup. | Isolate dangerous systems through trained staff and restore essential power. |
| Computer/IT/communication | Protect data and communication, maintain backups and mapping systems. | Restore networks, support verified incident information and protect sensitive records. |
For example, after a flood, civil engineers assess road access, electrical teams make damaged installations safe, mechanical teams restore pumps and IT teams support reliable information sharing. Coordination avoids restoring one system in a way that endangers another.
Q7(a). Explain five forest-fire causes and five immediate response measures. [10 practice marks]
Answer
Five causes
- Lightning. A strike can ignite sufficiently dry vegetation, especially when little rain reaches the ground.
- Unattended flames. Careless campfires, discarded smoking materials or other open flames can ignite litter.
- Escaped burning. Agricultural or debris burning can spread into nearby forest when control fails.
- Deliberate ignition. Arson can start a fire; motives and responsibility require investigation rather than assumption.
- Equipment or electrical faults. Sparks and damaged power infrastructure can ignite dry fuel. Heat, drought and wind make fuels drier and spread faster; they are not always the ignition source themselves.
Five immediate response measures
- Detect, report and assess. Report the location, fire direction, weather, access and people at risk. Authorities assess fuel, terrain and expected spread.
- Warn and evacuate. Issue clear route and shelter instructions, assist vulnerable residents and close unsafe roads. Avoid sending people into smoke or the expected fire path.
- Establish safe command and access. Coordinate fire and forest services, protect responders and maintain communication, escape routes and safety zones.
- Contain and suppress professionally. Trained crews use tactics and equipment suitable for the fire, such as controlled suppression and prepared containment lines. Prescribed burning or back-burning is specialist work, never an instruction for the public.
- Prevent re-ignition and meet urgent needs. Maintain professional patrols for hotspots and re-ignition, keep unsafe areas closed, and arrange urgent medical care, safe water and temporary shelter for affected people. Long-term forest restoration belongs to recovery rather than this immediate-response list.
Q7(b). Explain the Mumbai flood case and four risk-reduction measures. [10 practice marks]
Answer
- Event and setting: Extreme rainfall on 26 July 2005 caused severe flooding in Mumbai and surrounding areas.
- Causes and vulnerability: Intense rainfall interacted with inadequate or obstructed drainage, loss of natural storage, low-lying development and tide-related drainage constraints.
- Impacts: Transport paralysis, deaths and injuries, housing damage, disrupted livelihoods and public-health risks.
- Response and recovery: Rescue and shelter, restoration of services and attention to drainage, warning and urban-planning weaknesses.
- Lessons: Maintain drains; protect wetlands and natural flow paths; plan outfalls and detention; issue local warnings; regulate exposed development.
Three interacting causes
- Exceptional rainfall. A very large rainfall input rapidly produced runoff.
- Restricted conveyance. Blocked or inadequate drainage and constrained river/outfall flow limited removal of water.
- Exposed urban development. Impervious surfaces, loss of storage and low-lying development increased runoff and the people and assets affected.
Four mitigation measures
- Maintain the catchment and natural storage. Protect wetlands and floodplains and restore suitable vegetation. These measures slow runoff and store part of the floodwater, although they cannot eliminate extreme floods.
- Manage channels and drainage. Remove blockages and maintain bridges, culverts and drains. Engineering surveys should guide selective desilting; indiscriminate excavation can damage banks and ecosystems.
- Use storage and coordinated reservoir operation. Detention basins and reservoirs can hold water and release it more slowly. Forecasts, operating rules and downstream warnings are essential because storage and outlet capacity are finite.
- Apply floodplain zoning and resilient construction. Keep new critical facilities outside high-risk zones. Where occupation is permitted, use suitable raised floors, protected utilities and evacuation access to reduce losses.