Disaster Management · TEE · papers
Q7B · Discuss in detail application of GIS in drought-prone area mapping for drought manage…
2022-12-01 · Semester V/VII final
Actual older TEE paper · 100 marks · Q1 compulsory; any four of Q2–Q7
Q7B. Discuss in detail application of GIS in drought-prone area mapping for drought management. [10 marks]
Answer
GIS links information to location, allowing drought indicators and affected people to be analysed together. Remote sensing supplies repeated observations; field verification is still needed.
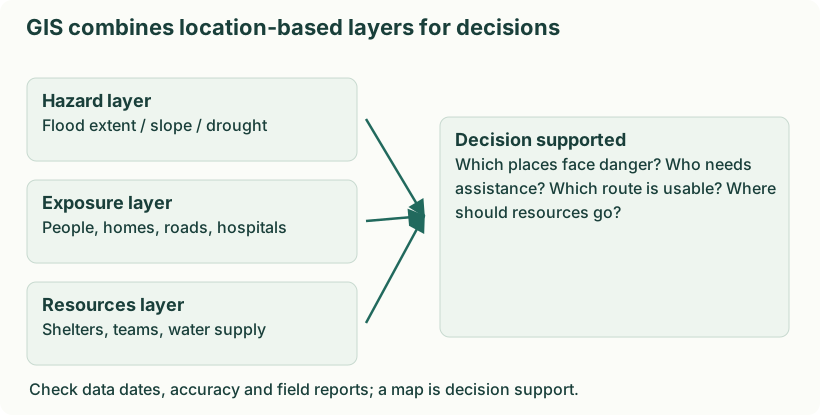
Diagram: GIS combines location-based layers for decisions. Labels: GIS combines location-based layers for decisions | GIS combines location-based layers for decisions | Hazard layer | Flood extent / slope / drought | Exposure layer | People, homes, roads, hospitals | Resources layer | Shelters, teams, water supply | Decision supported | Which places face danger? Who needs | assistance? Which route is usable? Where | should resources go? | Check data dates, accuracy and field reports; a map is decision support.
- Map rainfall deficits. Compare rainfall with the local long-term pattern and map persistent deficits. For example, identify districts with deficient seasonal rainfall rather than applying one national rainfall threshold.
- Observe soil and vegetation. Use soil-moisture information and vegetation indicators to locate crop stress. Ground observations help separate drought stress from disease, land-use change or poor data.
- Map available water. Locate reservoirs, wells, streams and supply systems and track their condition. Overlay settlements to identify people far from reliable drinking-water sources.
- Assess vulnerability. Combine rain-fed cultivation, livestock, poverty and access data with hazard indicators. Two equally dry areas can need different support because livelihood and service conditions differ.
- Prioritise and monitor action. Select recharge, supply and livelihood interventions and map their progress. For example, direct emergency water to poorly served settlements while planning long-term watershed work.
- Communicate limitations. Show data dates, uncertainty and update schedules. A map supports judgement; it does not automatically prove a village has water or that an individual household received relief.