Disaster Management · TEE · papers
Q2A · Explain in detail with respect to its causes and stages of Disaster management the ca…
2023-12-04 · Semester V final
Actual older TEE paper · 100 marks · Q1 compulsory; any four of Q2–Q7
Q2A. Explain in detail with respect to its causes and stages of Disaster management the case study of “Tsunami in Indian Ocean, 2004”. [10 marks]
Answer
- Event and setting: On 26 December 2004 a major undersea earthquake near Sumatra generated a destructive Indian Ocean tsunami.
- Causes and vulnerability: Seafloor displacement generated waves; exposed coastal settlements and limited warning readiness increased losses.
- Impacts: Coastal inundation, housing and livelihood destruction and disruption across several countries, including India.
- Response and recovery: Rescue, shelter and livelihood rehabilitation; India subsequently strengthened tsunami monitoring and warning through INCOIS/ITEWC.
- Lessons: Combine ocean/seismic monitoring with last-mile warnings, marked evacuation routes, drills, risk-informed coastal development and accessible safe destinations.
For tsunami management, GIS provides a common location-based picture for agencies. Data quality, access, update time and field verification determine its usefulness.
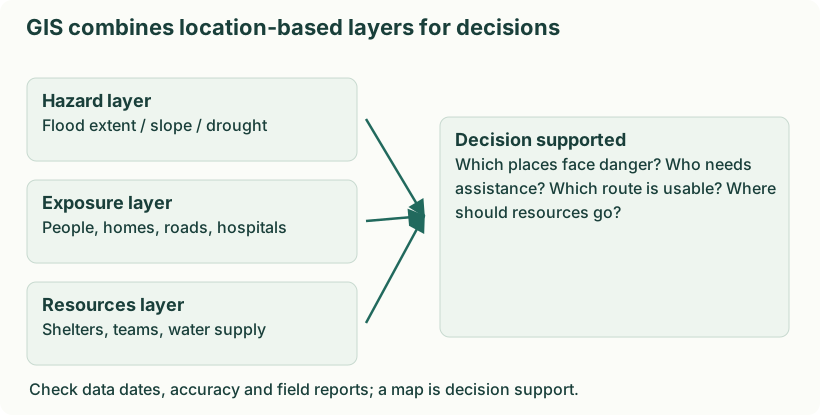
Diagram: GIS combines location-based layers for decisions. Labels: GIS combines location-based layers for decisions | GIS combines location-based layers for decisions | Hazard layer | Flood extent / slope / drought | Exposure layer | People, homes, roads, hospitals | Resources layer | Shelters, teams, water supply | Decision supported | Which places face danger? Who needs | assistance? Which route is usable? Where | should resources go? | Check data dates, accuracy and field reports; a map is decision support.
- Mitigation. Combine coastal elevation, modelled inundation and exposed settlements to guide land use and locate critical facilities outside high-risk areas.
- Preparedness. Map safe high ground, marked routes, travel time, shelters and people needing assistance. Use realistic scenarios in evacuation drills.
- Response. Overlay verified inundation, blocked roads, stranded people and available rescue resources. Use updated information to select safer access and prioritise urgent assistance.
- Recovery. Compare before/after imagery, map damage and service restoration, plan safer reconstruction and monitor whether assistance reaches affected settlements.
Remote sensing can update affected-area mapping, but weather, resolution, signal availability and processing time may limit observations. Protect sensitive household and health information when sharing maps.
Four measures to reduce future losses
- Monitoring and warning. Connect seismic/ocean observations to actionable public alerts.
- Evacuation routes and drills. Mark safe routes and destinations and include people needing assistance.
- Risk-informed siting. Keep critical facilities and new vulnerable development outside mapped inundation zones.
- Resilient services and recovery. Protect lifelines, prepare backups and rebuild with reduced exposure and better construction.
These measures reduce disaster impacts; they cannot prevent the submarine earthquake or every tsunami.