Disaster Management · TEE · papers
Q1C · Demonstrate in detail the application of GIS in 4 phases of Droughts Disaster Managem…
2024-12-10 · Semester V final
Actual older TEE paper · 100 marks · Q1 compulsory; any four of Q2–Q7
Q1C. Demonstrate in detail the application of GIS in 4 phases of Droughts Disaster Management considering a case study example. [5 marks]
Answer
GIS links information to location, allowing drought indicators and affected people to be analysed together. Remote sensing supplies repeated observations; field verification is still needed.
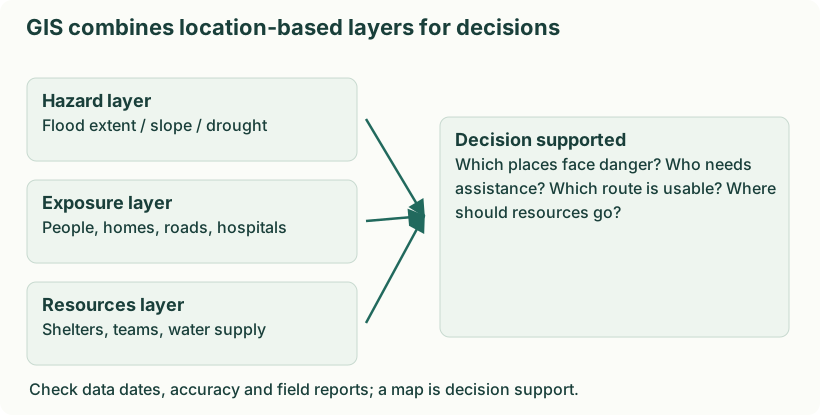
- Map rainfall deficits. Compare rainfall with the local long-term pattern and map persistent deficits. For example, identify districts with deficient seasonal rainfall rather than applying one national rainfall threshold.
- Observe soil and vegetation. Use soil-moisture information and vegetation indicators to locate crop stress. Ground observations help separate drought stress from disease, land-use change or poor data.
- Map available water. Locate reservoirs, wells, streams and supply systems and track their condition. Overlay settlements to identify people far from reliable drinking-water sources.
- Assess vulnerability. Combine rain-fed cultivation, livestock, poverty and access data with hazard indicators. Two equally dry areas can need different support because livelihood and service conditions differ.
- Prioritise and monitor action. Select recharge, supply and livelihood interventions and map their progress. For example, direct emergency water to poorly served settlements while planning long-term watershed work.
- Communicate limitations. Show data dates, uncertainty and update schedules. A map supports judgement; it does not automatically prove a village has water or that an individual household received relief.
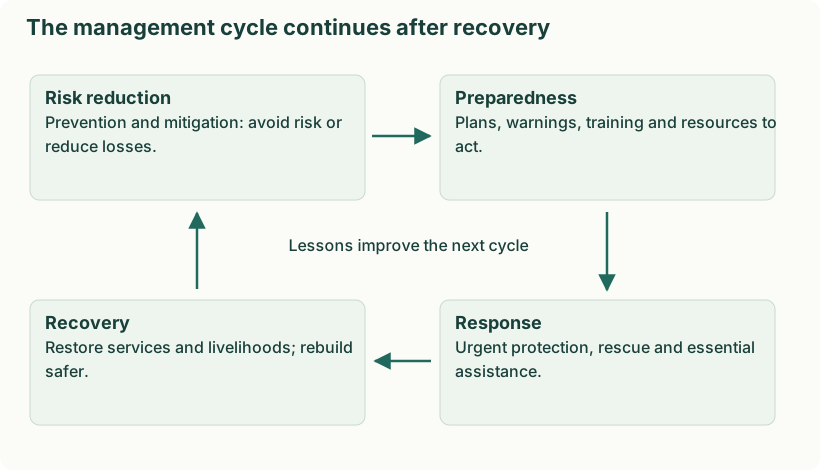
- Prevention and mitigation. Reduce avoidable vulnerability through watershed conservation, suitable cropping, efficient water use and sustainable groundwater management. These do not prevent every rainfall deficit.
- Preparedness. Monitor rainfall, storage and crop stress; plan water priorities, advisories, supply contingencies and livelihood support.
- Response. Provide safe drinking water and urgent livelihood, fodder or health support according to assessed need; manage scarce resources fairly.
- Recovery. Restore productive capacity and livelihoods, repair water systems and improve future planning. Review whether reconstruction and new demand would recreate the same water stress.
How the cycle connects in one village
Before a deficient monsoon, the village improves storage and water-use efficiency: this is mitigation. When monitoring shows a deficit, authorities activate a prepared priority-supply plan: this is preparedness. During severe shortage, safe drinking-water supply and targeted livelihood assistance are response. After conditions improve, repairing sources and restoring livelihoods are recovery. Reviewing which households were excluded should change the next plan. Thus recovery feeds into better mitigation and preparedness rather than simply restoring the earlier vulnerability.
In the six-stage lecture diagram, prevention and mitigation are shown separately, and rehabilitation/reconstruction are distinguished within recovery. The stages can overlap; an activity is classified by its purpose, not just its calendar date.