Disaster Management · TEE · papers
Q4A · Explain the detail the application of GIS in Disaster Management during the recovery …
2026-07-10 · Semester VI re-exam
Actual TEE paper · 100 marks · 3 hours · Q1 + any four of Q2–Q7
Q4A. Explain the detail the application of GIS in Disaster Management during the recovery stage [10 marks]
Answer
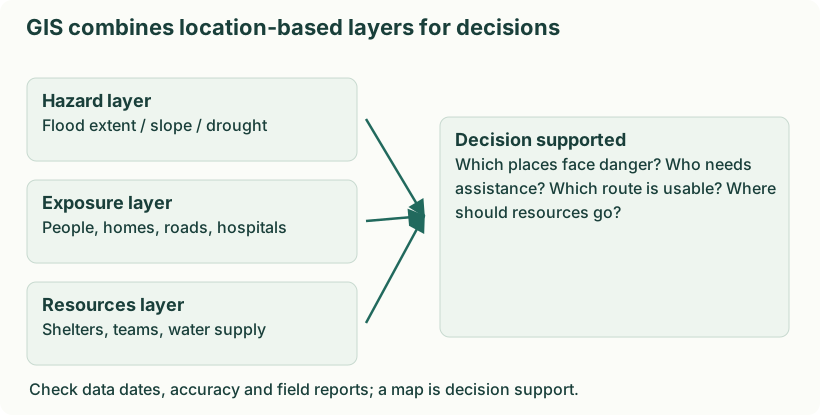
Diagram: GIS combines location-based layers for decisions. Labels: GIS combines location-based layers for decisions | GIS combines location-based layers for decisions | Hazard layer | Flood extent / slope / drought | Exposure layer | People, homes, roads, hospitals | Resources layer | Shelters, teams, water supply | Decision supported | Which places face danger? Who needs | assistance? Which route is usable? Where | should resources go? | Check data dates, accuracy and field reports; a map is decision support.
- Assess spatial damage. Compare pre-event records with imagery and field surveys to map damaged buildings, roads, crops and utilities.
- Prioritise restoration. Locate hospitals, drinking-water systems and isolated settlements so critical services and access are restored in a reasoned sequence.
- Match needs and resources. Map shelter, livelihoods and assistance coverage to reveal underserved areas; verify needs with affected communities.
- Plan safer reconstruction. Overlay hazard and land-use constraints to avoid rebuilding critical assets in the same high-risk locations.
- Monitor progress. Update repair status, housing completion and access to services. A shared map reduces duplication and supports transparent review.
- Review and protect data. Document uncertainty and survey dates, correct discrepancies and limit access to sensitive personal information.