Intelligent Systems II · TEE · mocks
Q6(b) Learner progression (Markov chain) [10]
Final examination · 24 Nov 2025
100-mark timed practice using the actual Final 2025 paper. Q1 compulsory; any four of Q2–Q7. Worked solutions are below the questions.
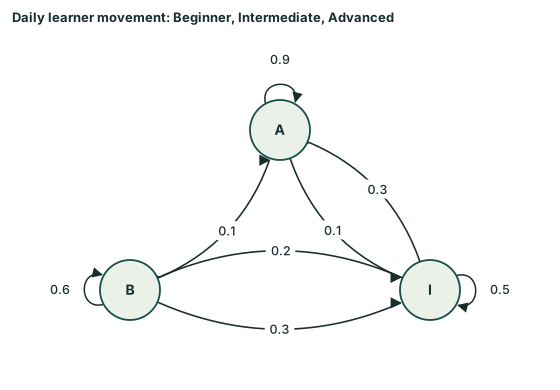
Question. Students are Beginner (B), Intermediate (I) or Advanced (A). Of Beginners, 60% remain, 30% become Intermediate, 10% go to Advanced. Of Intermediates, 20% fall back, 50% remain, 30% progress. Of Advanced, 10% drop to Intermediate, 80% remain and 10% stop (treated as remaining in A). 1. Construct the matrix. 2. Interpret retention, progression and regression. 3. Draw the diagram. 4. For [50, 30, 20], find the distribution after one day. 5. Which level has the largest steady-state share? [10 marks]
Answer
Given
All transition values are given in the full question. State order: B, I, A. Initial vector [50, 30, 20].
To find
The matrix, diagram, next-step vector and long-run comparison.
Formula and why it applies
Rows mean current state; columns mean next state. For each destination, multiply each origin amount by its transition probability, then add.
 LaTeX:
x_{next}=x_{now}P\qquad\pi=\pi P,\quad\sum_i\pi_i=1Solution
Step 1. Convert every origin row to probabilities
| From / To | B | I | A |
|---|---|---|---|
| B | 0.6 | 0.3 | 0.1 |
| I | 0.2 | 0.5 | 0.3 |
| A | 0 | 0.1 | 0.9 |
Each row sums to 1 because it lists all possible destinations for that origin. A percentage is divided by 100: 25%=.25.
Step 2. Interpret entries and draw the transitions
Diagonal entries are the fractions staying at their current state; off-diagonal entries are fractions moving to a different state. Each arrow uses its origin row and destination column. These fractions have different origin populations, so adding raw column probabilities does not give the number arriving.
Step 3. Next step: collect all contributions to B
| Origin | Current count/share | Transition to B | Contribution |
|---|---|---|---|
| B | 50 | 0.6 | 50 × 0.6 = 30 |
| I | 30 | 0.2 | 30 × 0.2 = 6 |
| A | 20 | 0 | 20 × 0 = 0 |
 LaTeX:
B_{new}=30+6+0=36Step 4. Next step: collect all contributions to I
| Origin | Current count/share | Transition to I | Contribution |
|---|---|---|---|
| B | 50 | 0.3 | 50 × 0.3 = 15 |
| I | 30 | 0.5 | 30 × 0.5 = 15 |
| A | 20 | 0.1 | 20 × 0.1 = 2 |
 LaTeX:
I_{new}=15+15+2=32Step 5. Next step: collect all contributions to A
| Origin | Current count/share | Transition to A | Contribution |
|---|---|---|---|
| B | 50 | 0.1 | 50 × 0.1 = 5 |
| I | 30 | 0.3 | 30 × 0.3 = 9 |
| A | 20 | 0.9 | 20 × 0.9 = 18 |
 LaTeX:
A_{new}=5+9+18=32Step 6. Stationarity: balance the Beginner column
 LaTeX:
b=0.6b+0.2i LaTeX:
0.4b=0.2i\quad\Rightarrow\quad i=2bStep 7. Balance the Advanced column
 LaTeX:
a=0.1b+0.3i+0.9a LaTeX:
0.1a=0.1b+0.3(2b)=0.7b LaTeX:
a=0.7b/0.1=7bStep 8. Use the sum of shares
 LaTeX:
b+i+a=1\quad b+2b+7b=1 LaTeX:
10b=1\quad b=0.1\quad i=0.2\quad a=0.7Advanced is not an absorbing state: its self-transition is .9, not 1.
Step 9. Compare the stationary shares with the initial shares
| State | Initial share | Stationary share | Change in share | Conclusion |
|---|---|---|---|---|
| B | 0.5 | 0.1 | -0.4 | Loses |
| I | 0.3 | 0.2 | -0.1 | Loses |
| A | 0.2 | 0.7 | 0.5 | Gains |
Compare like with like: divide counts by their total before comparing with stationary probabilities. “Stationary” means one more step leaves the shares unchanged.