Intelligent Systems II · TEE · papers
Q4(a) Fuzzy quality-control design [10]
Final examination · 17 Apr 2024
Actual historical paper ·100 marks attempted /140 offered · Q1 compulsory + any four of Q2–Q7. Source defects and solution assumptions are explicitly identified.
Design a fuzzy logic-based quality-control system for manufacturing that detects defects and decides whether to reject or accept a product. Inputs: Pressure [0,100] and Quality of material [0,100]. Output: Defect detection [0,100]. Use three descriptors per input and five per output; draw membership functions and derive rules. If pressure and material quality are high, accept; vice versa reject. Show defuzzification for Pressure 40 and Quality 80.
Answer
Given
Pressure=40, Material quality=80; ranges 0–100; three input terms and five output terms.
To find
A complete controller: membership graphs, rules, inference and crisp output.
Formula and why it applies
Fuzzification translates measured values into degrees. Min implements AND, max combines rules, and centroid converts the fuzzy output to one numerical command.
 LaTeX:
\alpha_r=\min(\mu_{A_r}(x),\mu_{B_r}(y)),\quad z^*=\frac{\int z\mu_{out}(z)\,dz}{\int\mu_{out}(z)\,dz}Solution
Step 1. Specify the inputs and output
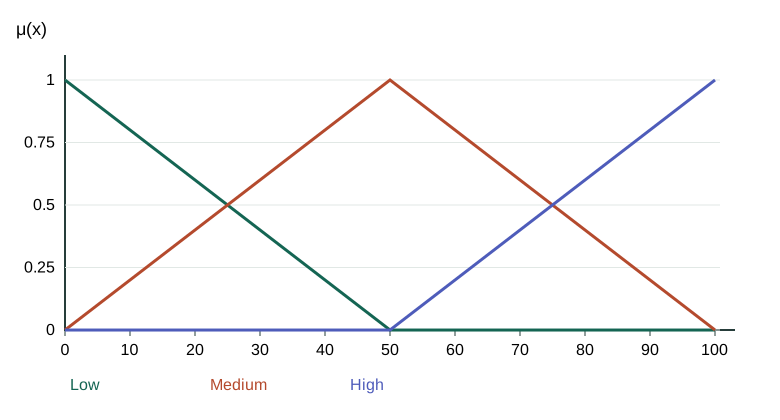
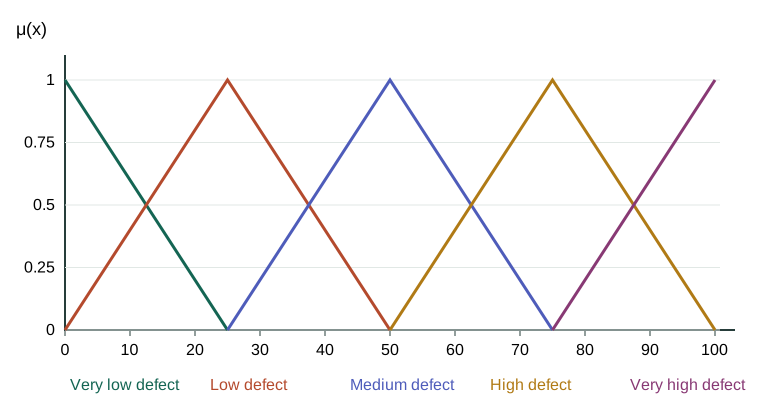
Pressure and Material quality each span 0–100. Use low=left shoulder (0,0,50), medium=triangle (0,50,100), high=right shoulder (50,100,100). Output is defect severity on 0–100; larger means worse quality.
Step 2. Define all nine IF–THEN rules
| Pressure / Material quality | Low | Medium | High |
|---|---|---|---|
| Low | Very high defect | High defect | Medium defect |
| Medium | High defect | Medium defect | Low defect |
| High | Medium defect | Low defect | Very low defect |
Higher pressure and better material reduce defect severity, as stipulated in this question. This is an exam design assumption, not a universal manufacturing rule.
Step 3. Fuzzify the two crisp readings
| Input | Low membership | Medium membership | High membership |
|---|---|---|---|
| Pressure=40 | 1/5 | 4/5 | 0 |
| Material quality=80 | 0 | 2/5 | 3/5 |
For Pressure=40: low=max(0,(50−40)/50)=0.2; medium=40/50=0.8; high=max(0,(40−50)/50)=0. For Material quality=80: low=0, medium=(100−80)/50=0.4, high=(80−50)/50=0.6.
Step 4. Fire every active rule with minimum
| Pressure | Material quality | AND strength | Output descriptor |
|---|---|---|---|
| Low | Medium | min(0.2, 0.4) = 0.2 | High defect |
| Low | High | min(0.2, 0.6) = 0.2 | Medium defect |
| Medium | Medium | min(0.8, 0.4) = 0.4 | Medium defect |
| Medium | High | min(0.8, 0.6) = 0.6 | Low defect |
The other rules have a zero antecedent membership and therefore fire at zero.
Step 5. Aggregate rules and clip each output membership
| Descriptor | Maximum firing strength |
|---|---|
| Very low defect | 0.0 |
| Low defect | 0.6 |
| Medium defect | 0.4 |
| High defect | 0.2 |
| Very high defect | 0.0 |
 LaTeX:
\mu_{out}(z)=\max_r\min(\alpha_r,\mu_{B_r}(z))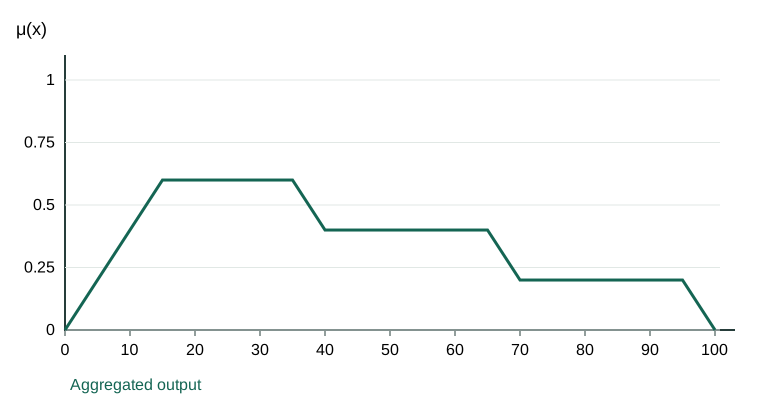
Step 6. Calculate centroid area and first moment
Split the upper outline at every corner and intersection. On a segment [a, b] with endpoint heights u and v, integrate the straight line. This counts overlap once.
 LaTeX:
A=(b-a)\frac{u+v}{2},\qquad M=aA+\frac{(b-a)^2(u+2v)}6,\qquad z^*=\frac{\sum M}{\sum A}| Segment [a, b] | Heights [u, v] | Area A | Moment M |
|---|---|---|---|
| [0, 15] | [0, 0.6] | 4.500000 | 45.000000 |
| [15, 25] | [0.6, 0.6] | 6.000000 | 120.000000 |
| [25, 35] | [0.6, 0.6] | 6.000000 | 180.000000 |
| [35, 40] | [0.6, 0.4] | 2.500000 | 93.333333 |
| [40, 50] | [0.4, 0.4] | 4.000000 | 180.000000 |
| [50, 55] | [0.4, 0.4] | 2.000000 | 105.000000 |
| [55, 65] | [0.4, 0.4] | 4.000000 | 240.000000 |
| [65, 70] | [0.4, 0.2] | 1.500000 | 100.833333 |
| [70, 75] | [0.2, 0.2] | 1.000000 | 72.500000 |
| [75, 95] | [0.2, 0.2] | 4.000000 | 340.000000 |
| [95, 100] | [0.2, 0] | 0.500000 | 48.333333 |
 LaTeX:
z^*=\frac{1525.000000}{36.000000}\approx 42.361111Step 7. Make the accept/reject decision
Choose and state a threshold: accept when defect severity is below 50, reject at or above 50. The calculated output is below 50, so accept. High/high gives very low defects and low/low gives very high defects, satisfying the question.