Intelligent Systems II · TEE · papers
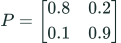
Q5(b) Brand-switching transition matrix [10]
Final examination · 17 Apr 2024
Actual historical paper ·100 marks attempted /140 offered · Q1 compulsory + any four of Q2–Q7. Source defects and solution assumptions are explicitly identified.
Two cold-drink brands A and B are sold. An A buyer has 80% chance of buying A next. A B buyer has 90% chance of buying B next. (I) Develop the transition matrix. (II) Interpret retention and loss, and retention and gain. (III) Draw the transition diagram.
Answer
Given
A→A=.80; B→B=.90. Two exhaustive states A and B.
To find
Transition matrix, diagram, and correct flow interpretation.
Formula and why it applies
Every row lists all possible destinations from one origin; its probabilities sum to one. Missing switch probability is 1 minus retention.
 LaTeX:
P_{ij}=P(\text{next}=j\mid\text{current}=i)Solution
Step 1. Find the two switch probabilities
 LaTeX:
P_{AB}=1-0.8=0.2,\quad P_{BA}=1-0.9=0.1Step 2. Put origins in rows
 LaTeX:
P=\begin{bmatrix}0.8&0.2\\0.1&0.9\end{bmatrix}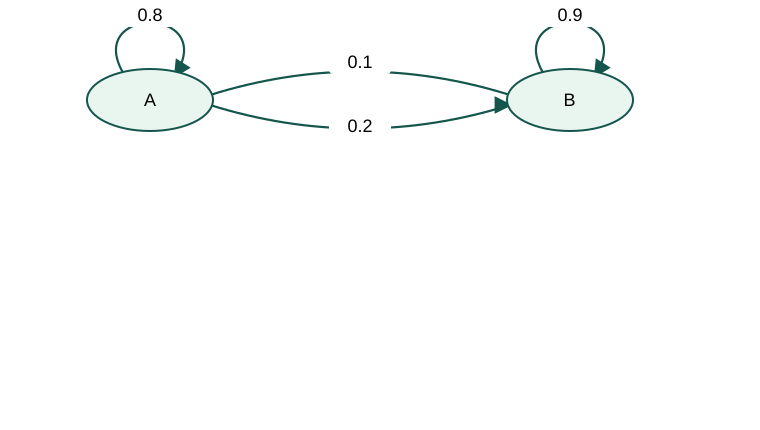
Step 3. Interpret retention, loss and gain with consistent populations
A retains 80% of its own current buyers and loses 20% to B. B retains 90% of its own buyers and loses 10% to A. A gains 10% of B’s current buyers; B gains 20% of A’s current buyers. These percentages have different denominators.
 LaTeX:
A_{next}=0.8A+0.1B,\quad B_{next}=0.2A+0.9BFor an illustrative 100 buyers of each brand, next counts are A=80+10=90 and B=20+90=110. Without initial counts, “A loses 10% overall” is not justified.