Intelligent Systems II · TEE · papers
Q5(b) Mean of maxima and centroid of trapezoids [10]
Re-examination · 25 Jun 2024
Actual historical paper ·100 marks attempted /140 offered · Q1 compulsory + any four of Q2–Q7. Source defects and solution assumptions are explicitly identified.
For the given membership functions determine the crisp output using (1) Mean of Maxima and (2) Centroid / Center of Area.
Answer
Given
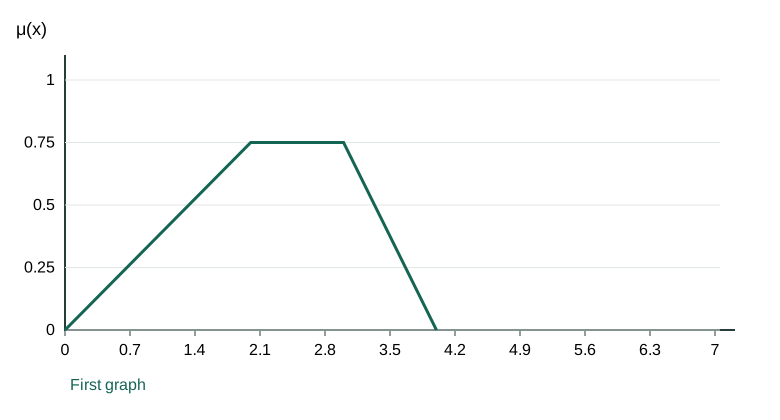
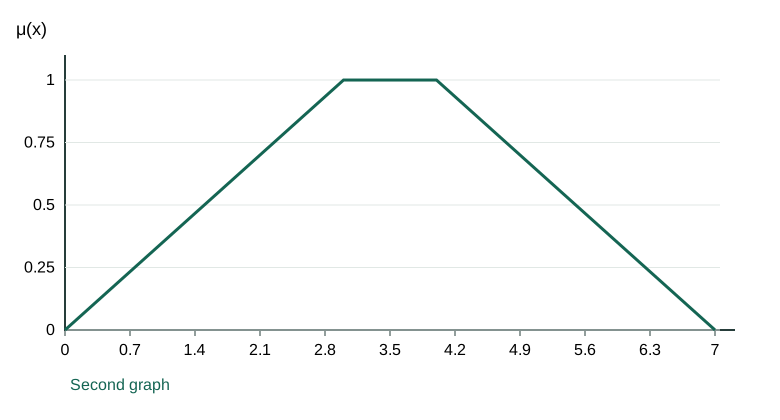
Two separate printed graphs; graph 1 corners(0,0),(2,.75),(3,.75),(4,0); graph 2 corners(0,0),(3,1),(4,1),(7,0).
To find
MOM and centroid for each graph.
Formula and why it applies
MOM averages the x-values where membership reaches its greatest height. For a continuous flat maximum[a, b], MOM=(a+b)/2. Centroid uses all area: divide the sum of area moments by total area.
 LaTeX:
z_{MOM}=\frac{a+b}{2},\qquad z_{COA}=\frac{\int x\mu(x)dx}{\int\mu(x)dx}=\frac{\sum A_ic_i}{\sum A_i}Solution
Step 1. MOM of the first graph
Maximum height.75 occurs throughout[2,3].
 LaTeX:
z_{MOM,1}=(2+3)/2=2.5Step 2. Centroid of the first graph
| Piece | Area | x centroid | Moment |
|---|---|---|---|
| Triangle 0–2 | ½×2×.75=.75 | (0+2+2)/3=4/3 | 1 |
| Rectangle 2–3 | 1×.75=.75 | 2.5 | 1.875 |
| Triangle 3–4 | ½×1×.75=.375 | (3+3+4)/3=10/3 | 1.25 |
 LaTeX:
z_{COA,1}=\frac{1+1.875+1.25}{.75+.75+.375}=\frac{4.125}{1.875}=2.2Step 3. MOM of the second graph
 LaTeX:
z_{MOM,2}=(3+4)/2=3.5Step 4. Centroid of the second graph
| Piece | Area | x centroid | Moment |
|---|---|---|---|
| Triangle 0–3 | 1.5 | 2 | 3 |
| Rectangle 3–4 | 1 | 3.5 | 3.5 |
| Triangle 4–7 | 1.5 | 5 | 7.5 |
 LaTeX:
z_{COA,2}=\frac{3+3.5+7.5}{1.5+1+1.5}=\frac{14}{4}=3.5The second graph is symmetric about 3.5, so its area centroid and plateau midpoint coincide. The first graph is asymmetric;2.2 and 2.5 need not agree.