Intelligent Systems II · TEE · papers
Q1(d) Cable-company Markov matrix and diagram [5]
Final / re-examination · 28 Apr 2025
Actual historical paper ·100 marks attempted /140 offered · Q1 compulsory + any four of Q2–Q7. Source defects and solution assumptions are explicitly identified.
A city is served by two cable TV companies, BestTV and CableCast. Due to their aggressive sales tactics, each year 40% of BestTV customers switch to CableCast; the other 60% of BestTV customers stay with BestTV. On the other hand, 30% of the CableCast customers switch to Best TV. The two states in this example are BestTV and CableCast.
- Express the information above as a transition matrix which displays the probabilities of going from one state into another state.
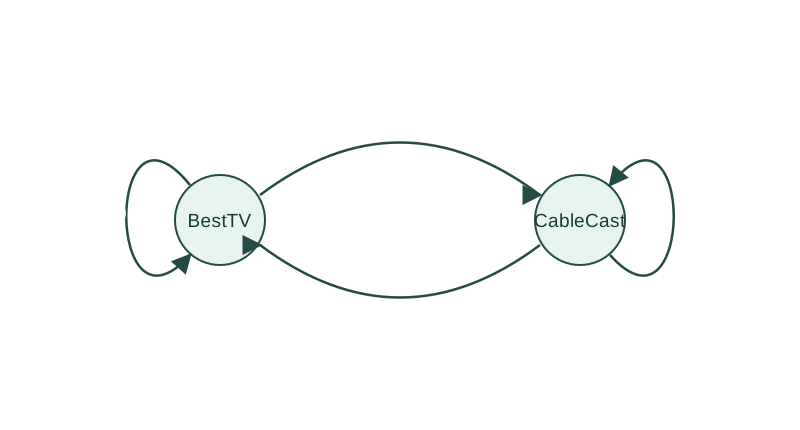
- Draw the State diagram for the above information.
Answer
Given
Order the states as B=BestTV and C=CableCast.
To find
The one-year transition matrix and all directed state transitions.
Formula and why
 LaTeX:
P_{ij}=P(\text{next state}=j\mid\text{current state}=i),\qquad\sum_jP_{ij}=1Rows mean current state; columns mean next state. Each row includes every possible destination.
Step 1. Complete the missing stay probability
BestTV stays =1−0.40=0.60. CableCast stays =1−0.30=0.70.
Step 2. Place each probability in its row
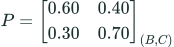 LaTeX:
P=\begin{bmatrix}0.60&0.40\\0.30&0.70\end{bmatrix}_{(B,C)}| Current → next | BestTV | CableCast | Row total |
|---|---|---|---|
| BestTV | 0.6 | 0.4 | 1 |
| CableCast | 0.3 | 0.7 | 1 |
Step 3. Draw the state diagram