Intelligent Systems II · TEE · papers
Q2(a) Fuzzy investment-controller design and centroid [10]
Final / re-examination · 28 Apr 2025
Actual historical paper ·100 marks attempted /140 offered · Q1 compulsory + any four of Q2–Q7. Source defects and solution assumptions are explicitly identified.
Create a fuzzy logic system to assist in investment decision-making. The system should consider variables such as risk tolerance, and historical performance to provide recommendations on asset allocation and investment strategies.
Input variables: Risk Tolerance (range 1-100) and historical performance (range 1-100). Output variable is Asset allocation (range 1-100) (Conservative, Balanced and Aggressive). Use 3 descriptors for input as well as output. Set rules to accurately predict the output. Show defuzzification for risk 40 and historical performance 8.
Answer
Given
Printed inputs: risk=40, historical performance=8, both on 1–100; output allocation score on 1–100. Membership shapes, breakpoints, rules and inference method are design choices, not printed data.
To find
One fully specified fuzzy system and the crisp output for these inputs.
Formula and why
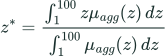
Use a Mamdani system: fuzzify inputs → apply min for AND → clip each output membership at its rule strength → aggregate by max → centroid. The result is a defined model output, not a guaranteed real investment return.
 LaTeX:
z^*=\frac{\int_1^{100}z\mu_{agg}(z)\,dz}{\int_1^{100}\mu_{agg}(z)\,dz}Step 1. Specify all membership functions
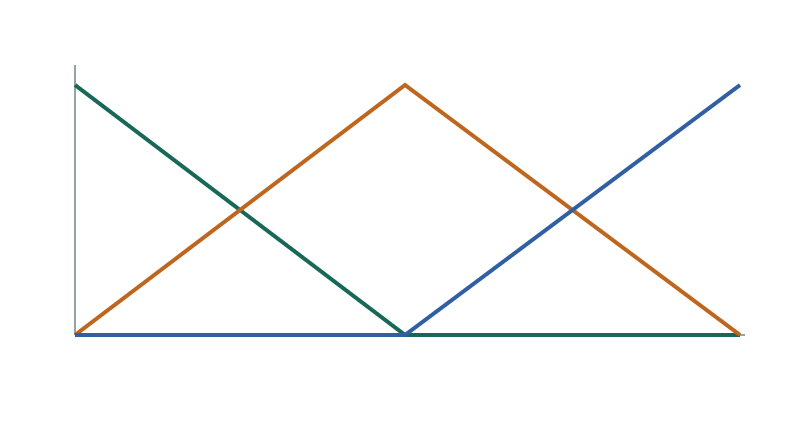
For either input t∈[1,100], choose Low as a left shoulder, Medium as a triangle and High as a right shoulder:
 LaTeX:
\mu_L(t)=\begin{cases}(50-t)/49&1\le t\le50\\0&50<t\le100\end{cases} LaTeX:
\mu_M(t)=\begin{cases}(t-1)/49&1\le t\le50\\(100-t)/50&50<t\le100\end{cases} LaTeX:
\mu_H(t)=\begin{cases}0&1\le t\le50\\(t-50)/50&50<t\le100\end{cases}Use the same three shapes on output z, named Conservative, Balanced and Aggressive. The score is an increasing aggressiveness index; it is not automatically a percentage in one specified asset. Higher scores recommend a more aggressive strategy within this illustrative model.
Step 2. State the nine rules
| Risk tolerance | Historical performance | Output |
|---|---|---|
| Low | Low | Conservative |
| Low | Medium | Conservative |
| Low | High | Conservative |
| Medium | Low | Conservative |
| Medium | Medium | Balanced |
| Medium | High | Balanced |
| High | Low | Balanced |
| High | Medium | Aggressive |
| High | High | Aggressive |
The rule base respects low risk tolerance even if past performance is high. Medium risk plus poor past performance moves towards Conservative. High risk with medium/high performance allows Aggressive. These are declared illustrative design judgments; other valid designs can yield other outputs.
Step 3. Fuzzify the two printed numbers
| Input | Low | Medium | High |
|---|---|---|---|
| Risk 40 | (50−40)/49=10/49=0.204082 | (40−1)/49=39/49=0.795918 | 0 |
| Performance 8 | (50−8)/49=42/49=0.857143 | (8−1)/49=7/49=1/7=0.142857 | 0 |
8 is retained exactly; it is not replaced with 80.
Step 4. Evaluate all nonzero rules
| Rule | AND calculation | Firing strength | Consequent |
|---|---|---|---|
| Low & Low | min(10/49,42/49) | 10/49 | Conservative |
| Low & Medium | min(10/49,7/49) | 7/49 | Conservative |
| Medium & Low | min(39/49,42/49) | 39/49 | Conservative |
| Medium & Medium | min(39/49,7/49) | 7/49 | Balanced |
The other five rules have a zero antecedent and do not fire. Maximum aggregation gives Conservative height 39/49, Balanced height 1/7 and Aggressive height 0.
Step 5. Construct the aggregated output
 LaTeX:
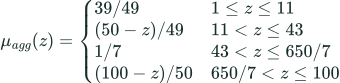
\mu_{agg}(z)=\max\{\min(39/49,\mu_L(z)),\min(1/7,\mu_M(z))\}The Conservative clip meets its descending slope at z=11. It falls to 1/7 at z=43. The Balanced descending side reaches 1/7 at z=650/7≈92.857143.
 LaTeX:
\mu_{agg}(z)=\begin{cases}39/49&1\le z\le11\\(50-z)/49&11<z\le43\\1/7&43<z\le650/7\\(100-z)/50&650/7<z\le100\end{cases}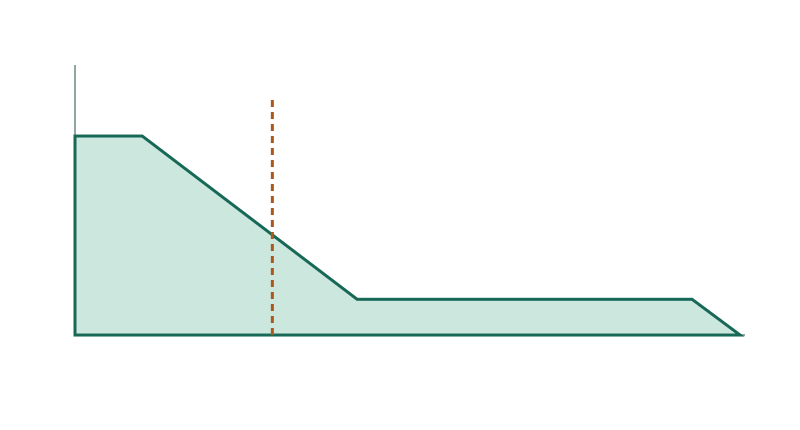
Step 6. Calculate area and first moment for each segment
For a segment µ(z)=mz+c between a and b, integrate its area A and first moment M as follows:
 LaTeX:
A=\frac m2(b^2-a^2)+c(b-a),\qquad M=\frac m3(b^3-a^3)+\frac c2(b^2-a^2)| Interval | Membership | Area A | First moment M |
|---|---|---|---|
| 1 to 11 | 39/49 | 7.959183673 | 47.755102041 |
| 11 to 43 | (50−z)/49 | 15.020408163 | 349.823129252 |
| 43 to 650/7 | 1/7 | 7.122448980 | 483.817784257 |
| 650/7 to 100 | (100−z)/50 | 0.510204082 | 48.590864917 |
For example, the first rectangle has area (11−1)×39/49=390/49 and moment (39/49)×(11²−1²)/2=2340/49. The other areas and moments follow explicitly: interval 11–43 has A=[−z²/98+50z/49] from 11 to 43=15.020408163 and M=[−z³/147+25z²/49] from 11 to 43=349.823129252. Interval 43–650/7 has A=(650/7−43)/7=7.122448980 and M=((650/7)²−43²)/14=483.817784257. Interval 650/7–100 has A=[2z−z²/100] from 650/7 to 100=0.510204082 and M=[z²−z³/150] from 650/7 to 100=48.590864917.
Step 7. Divide moment by area and interpret
 LaTeX:
\sum A=1500/49\approx30.612244898 LaTeX:
\sum M=637971/686\approx929.986880466 LaTeX:
z^*=\frac{637971/686}{1500/49}=\frac{212657}{7000}\approx\boxed{30.379571}The resulting allocation score leans Conservative for this declared rule base. A centroid is obtained from the aggregated area; do not replace this Mamdani calculation with an unexplained weighted average of label names.