Intelligent Systems II · TEE · papers
Q1(d) Savings and current accounts (Markov chain) [5]
Re-examination · 31 Jan 2026
Actual TEE re-exam · 100 marks · 3 hours · Q1 compulsory + any 4 of Q2–Q7 · every answer verified (key errors flagged)
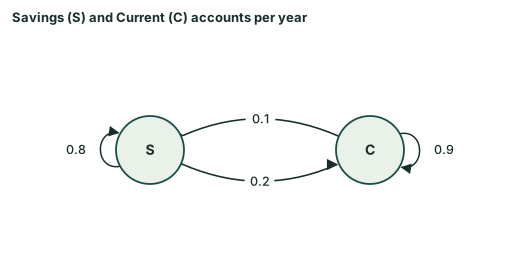
Question. Each year 20% of Savings holders switch to Current and 80% stay; 10% of Current holders switch to Savings and 90% stay. (a) Construct the transition matrix. (b) Draw the state diagram. [5 marks]
Answer
Given
All transition values are given in the full question. State order: S, C.
To find
The transition matrix and state diagram.
Formula and why it applies
Rows mean current state; columns mean next state. For each destination, multiply each origin amount by its transition probability, then add.
Solution
Step 1. Convert every origin row to probabilities
| From / To | S | C |
|---|---|---|
| S | 0.8 | 0.2 |
| C | 0.1 | 0.9 |
Each row sums to 1 because it lists all possible destinations for that origin. A percentage is divided by 100: 25%=.25.
Step 2. Interpret entries and draw the transitions
Diagonal entries are the fractions staying at their current state; off-diagonal entries are fractions moving to a different state. Each arrow uses its origin row and destination column. These fractions have different origin populations, so adding raw column probabilities does not give the number arriving.