Advertising and Public Relations · TEE · papers
Q6B · Elaborate the concepts of Brand Development Index and Category Development Index with interpretations for combinations of high and low values
2023-12-05 · Semester V final / re-exam
Actual TEE paper · 100 marks · Q1 compulsory + any four complete Q2–Q7
2023-12-05 · Q6B · Previous-paper question. Elaborate the concepts of Brand Development Index and Category Development Index with interpretations for combinations of high and low values. [10 marks]
Answer
Definition. An index compares a group’s share of users or sales with its share of the population, using 100 as the average benchmark.
In simple words. Sales/users ka share population se zyada? Index 100 se upar.
Understand it step by step
- Audience / user index: compare the segment’s share of product users with its share of population. The two percentages use their own relevant totals.
- BDI: Brand Development Index compares an area’s share of total brand sales with its share of population.
- CDI: Category Development Index uses total category sales instead of the brand’s sales.
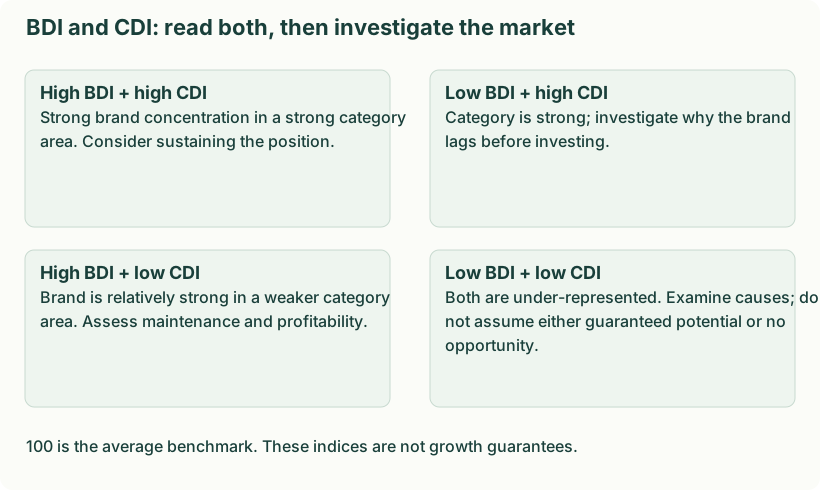
- Interpretation: 100 means proportional representation; above 100 means over-representation; below 100 means under-representation. The notes’ statement that anything below 100 is “average” is imprecise.
- Planning: high CDI with low BDI may reveal a brand opportunity, but first examine competition, distribution and profitability. An index is not a forecast or a proof of causation.
 LaTeX:
\text{BDI}=\frac{\%\text{ of total brand sales in area}}{\%\text{ of population in area}}\times100 LaTeX:
\text{CDI}=\frac{\%\text{ of total category sales in area}}{\%\text{ of population in area}}\times100See it in use
| BDI | CDI | Interpretation |
|---|---|---|
| High | High | Brand and category over-represented: consider sustaining strength. |
| Low | High | Category strong, brand relatively weak: investigate distribution/positioning/competition. |
| High | Low | Strong brand concentration in a weaker category: assess profitable maintenance. |
| Low | Low | Both under-represented: investigate causes before committing or withdrawing. |
An index of 100 is the average benchmark. These combinations are diagnostic clues, not guaranteed investment rules.
A small illustration of the formula
The recovered BDI/CDI questions ask for concepts and high/low interpretations; they do not supply numerical data. The following invented values illustrate the formula and are not a separate required PYQ calculation.
Given
| Population share | Brand-sales share | Category-sales share |
|---|---|---|
| 10% | 15% | 20% |
To find
Brand and category development indices.
Formula and why
 LaTeX:
\text{BDI}=\frac{B_{\%}}{P_{\%}}\times100,\qquad\text{CDI}=\frac{C_{\%}}{P_{\%}}\times100The common denominator is population share. Only the numerator changes between brand sales and category sales.
Step-by-step solution
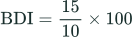
Step 1. Substitute for BDI
 LaTeX:
\text{BDI}=\frac{15}{10}\times100Step 2. Divide and scale BDI
 LaTeX:
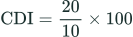
1.5\times100=150Step 3. Substitute for CDI
 LaTeX:
\text{CDI}=\frac{20}{10}\times100Step 4. Divide and scale CDI
 LaTeX:
2\times100=200Step 5. Compare each with 100
Both brand and category are over-represented relative to population.
Final answer: BDI = 150; CDI = 200.